Nils Flores · 5 September 2026
Analyzing Fiber Quality Metrics in Southern Wool Harvests Through Seasonal Data Patterns
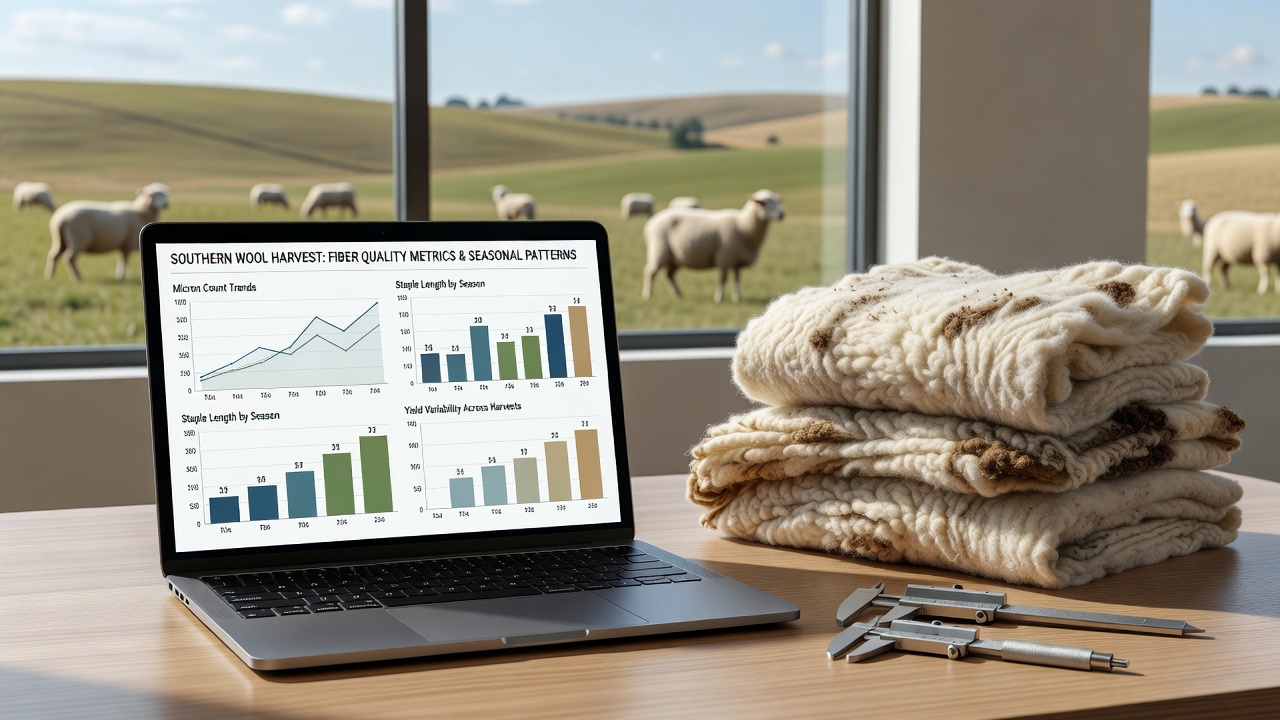
Seasonal shifts shape fiber quality metrics in southern wool harvests where temperature cycles, rainfall distribution, and pasture growth directly influence wool diameter, staple strength, and yield percentages. Researchers track these variables across Australia, New Zealand, and parts of South America because southern hemisphere production cycles run opposite to northern markets and create distinct data signatures each year. Data collected from 2020 through 2025 shows consistent patterns that repeat when spring rainfall arrives between August and October, followed by drier periods that affect fiber diameter distribution.
Core Metrics Used in Seasonal Analysis
Fiber diameter measured in microns remains the primary indicator, while staple length, tensile strength, and vegetable matter content provide supporting data points. Observers note that micron averages drop by 1.5 to 2.5 units when cool, moist conditions persist through late winter, whereas strength readings measured in Newtons per kilotex often decline after extended dry spells reduce pasture protein levels. Yield percentages, calculated as clean wool weight over greasy weight, fluctuate between 68 and 78 percent depending on how much dust and plant matter accumulates during summer months.
Analysts compile these figures from shearing records and laboratory tests conducted at regional hubs. In southern Australia, for example, the same flocks sampled in September 2026 will supply baseline data that can be compared against 2024 and 2025 harvests to isolate the effect of the unusually wet July period recorded that year.
Seasonal Data Patterns Across Regions
Patterns emerge when monthly climate records align with test results. Spring growth in the southern tablelands typically produces finer wool because rapid pasture development supplies higher protein levels during follicle formation. Summer heat stress, by contrast, tends to coarsen fiber and reduce staple length because sheep divert energy toward thermoregulation rather than wool growth. Autumn rainfall then influences next season's starting condition by rebuilding soil moisture reserves before winter.
Figures from the Australian Bureau of Agricultural and Resource Economics reveal that clean wool yield in the southern states averaged 72.4 percent during the 2025 harvest, down slightly from 74.1 percent in 2023, coinciding with reduced spring rainfall totals. Similar datasets maintained by New Zealand's wool industry show staple strength dropping below 30 N/kt when summer temperatures exceed long-term averages for more than six weeks.

Analytical Methods and Tools
Time-series modeling connects climate variables with fiber outcomes. Regression equations incorporate cumulative rainfall, mean minimum temperatures during key growth windows, and pasture biomass estimates derived from satellite imagery. These models allow forecasters to project micron ranges for the upcoming September 2026 clip based on winter conditions observed through July of that year. Validation studies compare predicted versus actual results, and accuracy improves when data from at least five consecutive seasons are included.
Geographic information systems overlay soil type maps with climate grids so analysts can isolate micro-regional effects. One study covering the southern slopes of New South Wales demonstrated that sheltered valleys produced wool 1.8 microns finer than exposed ridges during the same season because wind exposure increased feed intake requirements and altered nutrient allocation. Such spatial analysis helps processors anticipate batch variability before wool reaches auction floors.
Industry Applications of Pattern Data
Breeders use seasonal trend information to adjust mating schedules so that peak wool growth coincides with favorable pasture conditions. Processors adjust scouring and carding parameters when test certificates show elevated vegetable matter from drier summers. Exporters monitor micron distribution curves because buyers in Italy and Japan specify narrow tolerance bands that become harder to meet when seasonal extremes widen the distribution.
Market reporting services publish monthly summaries that compare current harvest metrics against five-year rolling averages. These reports highlight when deviations exceed two standard deviations, prompting closer examination of climate records or flock health events. In September 2026, analysts will again compare early spring test results against the same month in prior years to determine whether the recent La Niña pattern has produced measurable shifts in average fiber diameter.
Conclusion
Seasonal data patterns supply objective benchmarks for evaluating fiber quality across southern wool regions. Consistent collection of diameter, strength, and yield measurements, combined with aligned climate and pasture records, enables accurate identification of recurring influences and supports planning for harvests such as the one scheduled for September 2026. Continued refinement of these analytical approaches improves supply chain coordination without relying on subjective interpretation.